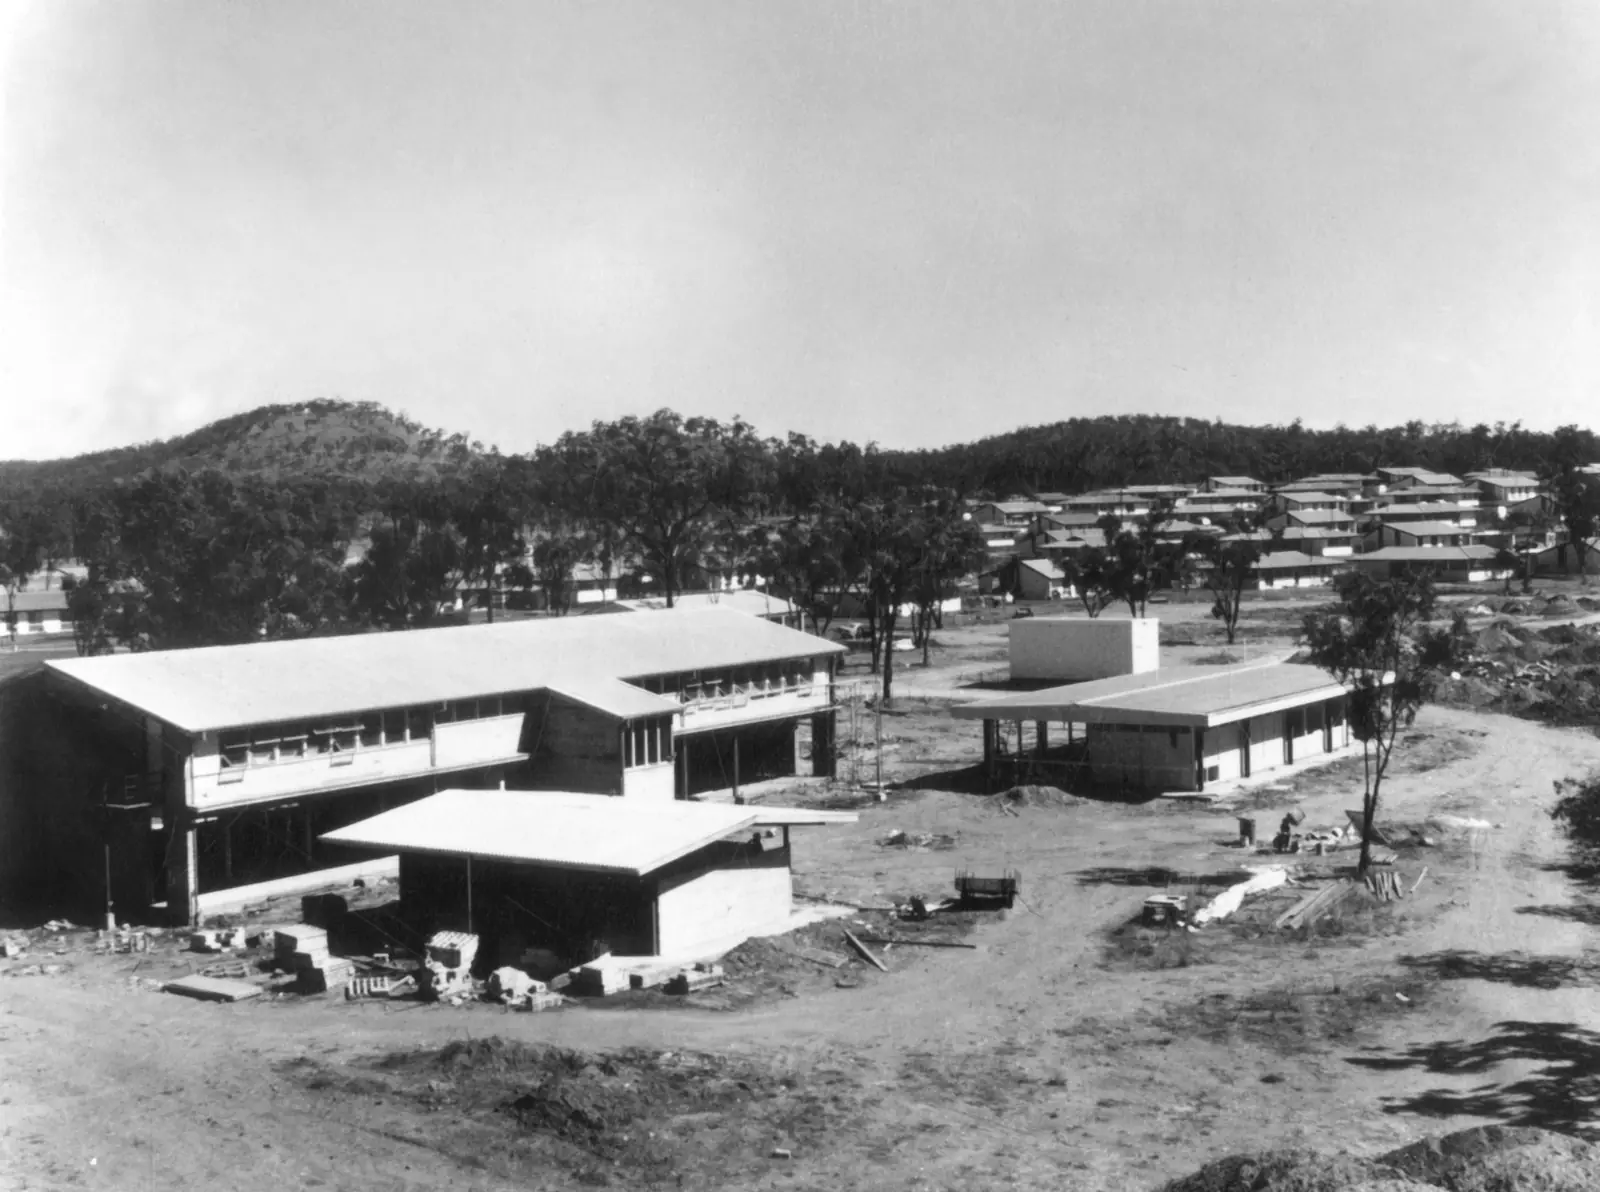
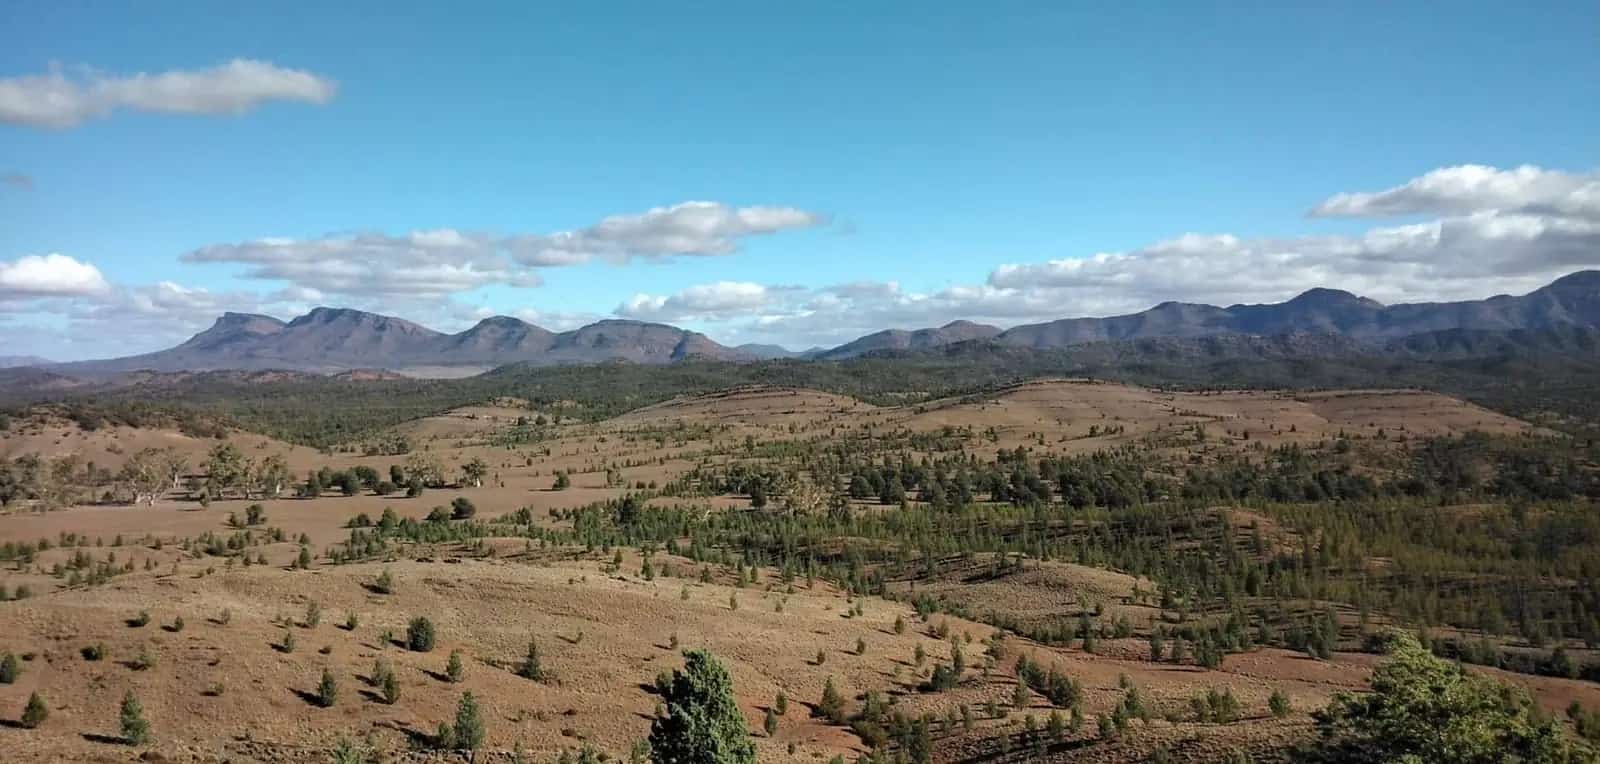
Greenvale sits in inland north Queensland at the Bureau of Meteorology’s Greenvale rainfall station (032122). BOM’s Climate Data Online page lists the station as opened 1890, status Open, 18.98°S, 145.11°E, elevation 427 m. Figures on this page are copied from that all-years monthly rainfall table as fetched for this guide. They will drift as extra years are added. Always open the BOM Greenvale monthly rainfall table before you treat a number as current.
This page does not fill empty temperature months from memory. A Climate Data Online request for monthly mean maximum temperature at site 032122 returned no data. Where a mean maximum is needed for packing, the comparison table below is Charters Towers Airport, 203 km south, clearly labelled as a different station.
Greenvale rainfall (station 032122)
All-years means from BOM’s summary statistics on the rainfall page:
| Month | Mean rainfall (mm) |
|---|---|
| January | 149.7 |
| February | 143.3 |
| March | 103.6 |
| April | 29.3 |
| May | 20.0 |
| June | 14.2 |
| July | 7.5 |
| August | 6.0 |
| September | 8.2 |
| October | 16.0 |
| November | 47.3 |
| December | 86.4 |
| Annual | 633.4 |
Median annual rainfall in the same table is 602.1 mm. The lowest annual total shown is 216.6 mm; the highest is 1458.3 mm. January’s 5th percentile is 31.9 mm and 95th percentile is 371.3 mm — a reminder that a “mean wet month” still includes dry Januaries and extreme Januaries. August’s mean 6.0 mm is the driest month in the table.
The daily record on that page is not continuous in recent decades: many years after the mid-1990s are blank or nearly blank, with only scattered months in 2018–2020. Means are still the official all-years statistics BOM prints. They are not a week-ahead forecast.
What the rainfall averages mean on the road
Summer. A January mean of 149.7 mm and a February mean of 143.3 mm are enough to close floodways on the Gregory Developmental Road and to put water over the upper Burdekin. Visit Charters Towers’ Greenvale accommodation listing places the town on the river. That is why QLDTraffic (13 19 40) is a morning habit, not an optional extra. See wet season and road closures. Highest annual rainfall in the Greenvale table, 1458.3 mm, shows what a big year looks like; do not treat 633.4 mm as a cap.
Winter and early spring. June 14.2 mm, July 7.5 mm, August 6.0 mm, September 8.2 mm is the dry touring core on paper. Nights still need layers even without a local minimum-temperature table. This is the season Visit Charters Towers is describing when it calls Greenvale a welcome stop between Cairns and Charters Towers.
Shoulder months. April 29.3 mm and November 47.3 mm sit between the wet summer and the dry winter. Storm cells still happen. A sealed highway is not a dry highway.
Temperature: nearest published climate-averages table
BOM’s climate-averages summary for Charters Towers Airport (034084) is the temperature table used on this site’s Charters Towers weather page. Visit Charters Towers puts Greenvale 203 km north of that city. Use the airport figures only as a regional comparison, not as Greenvale township means.
Charters Towers Airport (as cited on the Charters Towers guide): annual mean rainfall 651.3 mm (29 years, 1992–2026); hottest mean maximum December 34.7 °C; coolest mean maximum July 25.1 °C; January mean rainfall 150.5 mm; September 8.3 mm. Full monthly columns: BOM Charters Towers Airport.
The rainfall pattern is similar in shape to Greenvale’s: wet January, dry spring. That does not license copying December’s 34.7 °C onto Greenvale’s main street. Elevation at Greenvale station is 427 m; Charters Towers Airport is 292 m on that climate page. Different sites, different products.
Our outback weather by month guide explains how to read inland Australian columns generally.
When to visit Greenvale
If you are choosing months for the Gregory Developmental Road:
- June to September — lowest Greenvale rainfall means; the usual compromise for vans and 2WD highway travel, still inside dry-season touring peaks further north on the Savannah Way, so book accommodation.
- April–May and October — possible, with a QLDTraffic check every morning.
- November–March — possible if you have air-conditioning, extra water, spare days, and a willingness to sit in town when the highway is closed. Do not tent through a 150 mm January mean unless you know wet-season camping.
Greenvale is approximately 250 km north-west of Townsville on the Visit Charters Towers accommodation listing. People drive it year-round when the road is open. Climate is a packing, booking and closure problem more than a “town closed” problem. See best time to visit the outback.
Station notes
Traveller pages sometimes quote Charters Towers, Townsville or Georgetown temperatures for Greenvale. This guide uses Greenvale 032122 for rain because that is the local BOM rainfall station, and it refuses to invent temperature. If you need every month’s millimetres, do not copy a screenshot from a blog — open BOM.
The 2021 Census counted 192 people in the locality. A small town does not change the monsoon-edge rainfall pattern. It does change how quickly you can buy ice when a storm has knocked out a fridge.
Combining weather with a trip plan
The Three Rivers Hotel meal in the shade is the visitor-page stop. It is more pleasant in the dry season. We do not have a sourced “best month for the sausage tree” in the facts, so we do not invent one.
For towing, wet grass after summer storms is as much a problem as the highway. See Greenvale caravan parks and caravanning in the outback. Watch for kangaroos at dusk on the Lynd Highway regardless of rainfall means.
If QLDTraffic has closed the Gregory Developmental Road, the weather plan is to stay in Charters Towers or Greenvale, not to “have a look” at a flooded floodway.
Related
Plan this trip
Tell us the dates, who you are travelling with and where you need help. We reply with planning notes for Greenvale — we are not a booking agent.
Frequently asked questions
How much rain does Greenvale get?
Bureau of Meteorology station Greenvale (032122) has an all-years annual mean rainfall of 633.4 mm. January’s mean is 149.7 mm; August’s mean is 6.0 mm. The highest annual total in the table is 1458.3 mm; the lowest is 216.6 mm.
Does Greenvale have a BOM temperature averages table?
Not on the climate-averages product used for this research. Station 032122 publishes monthly rainfall. A request for monthly mean maximum temperature for that site number returned no data. Do not fill the gap from memory.
When is the best weather to drive the Gregory Developmental Road?
Greenvale’s rainfall means are lowest from June to September. Check QLDTraffic in every season. Summer storm rain still closes floodways on a sealed highway.
Sources and further reading
Facts on this page were checked against these primary and official sources. Conditions change — confirm before you travel or buy.
- Monthly rainfall — Greenvale (032122) — Bureau of Meteorology
- Climate statistics for Charters Towers Airport (034084) — Bureau of Meteorology
- Greenvale (Qld) 2021 Census QuickStats — Australian Bureau of Statistics
- QLDTraffic — Queensland Government
- Outback weather by month — Outback Now